
Climate scenario analysis is a crucial tool for informing your organization’s strategic planning for organizational climate impacts. As useful as it is, it is also complex, and getting started may seem daunting. Picking up where we left off in our last blog on the topic, we dive deeper into how to get started with your first climate scenario analysis. A few questions need to be answered before you begin: What type of climate-related scenario analysis will you choose to do? What scenarios are most appropriate for your analysis? Will you design your own scenarios or use publicly available ones? This blog will help you answer these questions to prepare you for your first venture into scenario analysis.
Types of climate-related scenario analysis
Qualitative climate scenario analysis
Broadly speaking, scenario analyses can be grouped into two types: quantitative and qualitative. A qualitative climate change scenario analysis can rely on industry trends that are grounded in real data and analysis. Or, it can rely on historical and experiential information, making it an accessible entry point for those just getting started. The Task Force on Climate-related Financial Disclosures (TCFD) offers “qualitative scenario narratives” as a potential first step. These can help management start thinking about the set of climate risks and opportunities they could be exposed to now or in the future.
Data accumulation for a qualitative scenario analysis can be as straightforward as gathering experiential information related to climate change from different departments. Management can synthesize this information to create storylines about possible future pathways of development. This exercise, while simple, can give management a glimpse into how climate change will impact their organization. It can also help identify what data points require more robust monitoring to enable further analysis. For example, a big bank might gather information showing that many of its investments have been impacted due to wildfires. Its response could be to build a more robust tracking system for wildfire-related metrics (humidity levels, temperature, precipitation, wind speed and direction, etc.).
Qualitative scenario analysis can also be research-based. For example, a real estate company could conduct surveys to understand how their tenants have responded to the company’s green building practices and low-carbon certifications. This information could be combined with industry studies on green leases, retrofit costs and future regulatory insights to conduct scenario analyses exploring different long-term green building strategies and/or marketing strategies for new tenants.
The ability to explore the implications of non-quantifiable information makes qualitative climate risk scenario analysis well-suited to assessing transitional climate risks. It also is a good introduction and discussion starter about forward-looking trends and the “what if?” discussion. Conversely, qualitative scenarios only give high-level views of physical climate risks, which can often be assessed by meticulously analyzing numerical data. Although insights can be gained from qualitative scenarios, investors may prefer to see quantitative data at the root of major strategic decisions. This may lead some to push back against using the results of a qualitative climate scenario analysis to drive major decisions.
Quantitative climate scenario analysis
As the name implies, this type of scenario analysis is expressed by numbers. In general, large amounts of data are required to perform such analyses, but some datasets are publicly available as discussed below. Where data is not available, data collection and monitoring systems may be needed. Companies with some experience conducting scenario analysis may already have such data systems in place.
Companies can use numerical data as inputs into climate models to simulate how their assets/operations might hold up under a variety of plausible scenarios. One use of the outputs is as thresholds that trigger strategies or policies to mitigate risk or capitalize on opportunities. While climate models are not intended to produce 100% accurate projections, their outputs can be interpreted as guidelines and should be used in conjunction with other signals to make decisions.
Quantitative climate risk scenario analysis is appropriate for assessing any climate risk that can be described with numbers. Both physical climate impacts (e.g. increased precipitation) and transition-related impacts (e.g. costs of carbon emissions) can be assessed using quantitative scenario models. If you have a robust set of numerical data related to the climate risks of interest to your business, regardless of whether or not that risk is physical or transitional, you can use this data to inform quantitative scenario analysis.
Downer Group, an integrated services company with operations in Australia and New Zealand, provides a great example of the use of quantitative climate scenario analysis to assess both physical and transitional climate risks. In 2019, they conducted a climate scenario analysis using two sets of public scenarios: the Representative Concentration Pathways (RCPs) and the Shared Socioeconomic Pathways (SSPs). Downer uses the RCPs to inform global warming in their analysis, and the SSPs to inform broader energy and socioeconomic conditions. Their analysis looks at three key areas that impact various areas of their business:
- Physical impacts of climate change (weather) – this impacts Road Services, Rollingstock Services, Transport Projects, Utilities and New Zealand;
- Energy transition (thermal coal transition) – this impacts Mining and Asset Services; and,
- Changing carbon/energy policy – this impacts the entire Group.
The outputs of this analysis were both quantitative and qualitative. They were used to test the organization’s resilience and to inform their strategy development.
There is no rule for how to choose which type of climate scenario analysis to conduct. Considering your vulnerability to physical and transitional climate risks can help guide your decision, as can considering your familiarity with scenario analysis. However, the type of climate scenario analysis is just one piece of the puzzle. Choosing the scenarios to employ in your analysis is arguably just as important.
Choosing scenarios for your analysis
Custom scenarios vs. public scenarios
It’s important to choose the right scenario for your analysis. Climate scenario analysis is performed in the context of a climate future, e.g., 2° or 4° of warming. Depending on the model, different areas of science or socio-economics will be represented better than others. Therefore, you might have a 2° scenario and if you are focused on physical impacts, you may choose a model that focuses on atmospheric systems. Conversely, if you are more focused on how a particular sector will fare in a 2° world, your model might include sector resource cost curves and economics. When selecting your scenarios, you have the choice between building your own custom scenarios or choosing publicly available ones. This choice is often one of the most daunting ones of this process, as we discuss below.
Building your own scenarios gives you control over tweaking the parameters of most importance to your company, but it requires a level of climate knowledge to be confident in the decisions. On the other hand, there is a large and growing list of public scenarios available at your disposal. Public scenarios have been developed for many different sectors. Some apply best to physical climate risks, and others to transitional climate risks. So, there is a good chance that you can find some to fit your specific needs. Choosing a widely used public scenario also gives you the opportunity to directly compare your analysis results with your peers. Figure 1 shows the most popular scenarios used in 2020.
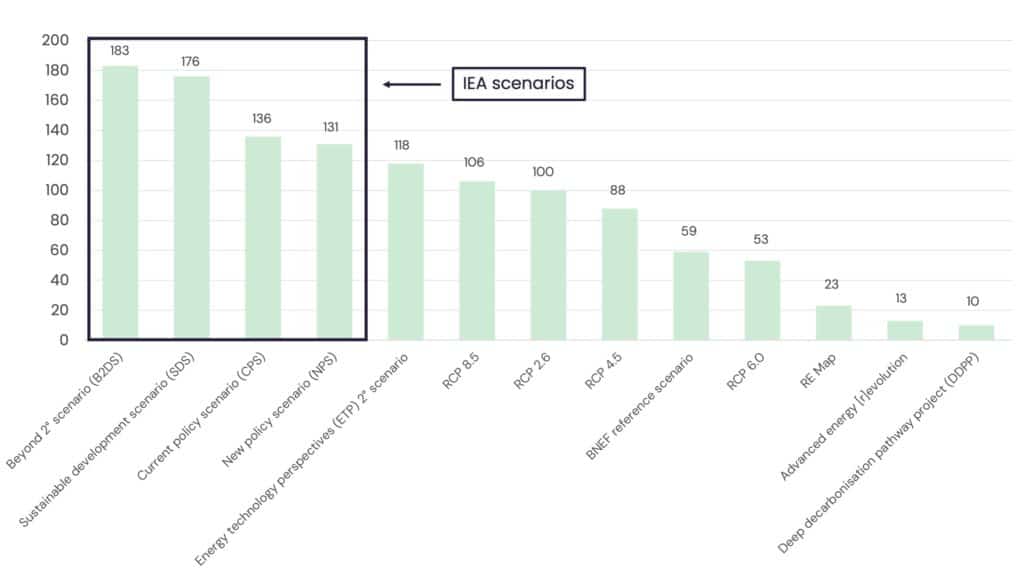
As seen in Figure 1, some of the most popular scenarios are the International Energy Agency (IEA) and RCP scenarios. Below, the two sets of scenarios are described to highlight their advantages and disadvantages.
RCP scenarios
The RCP scenarios form the basis of the Intergovernmental Panel on Climate Change’s (IPCC) analysis of the state of climate change. The IPCC produces assessment reports, the latest of these reports being AR5, that detail the findings of these analyses.
The RCP scenarios represent different measures of atmospheric greenhouse gas concentration trajectories for the long-term future. The four original RCP scenarios presented in the AR5 report are:
- RCP 2.6 – this represents the best-case scenario. This pathway would likely cap global warming at 2°C by the year 2100, however there is some skepticism surrounding how achievable this scenario is;
- RCP 4.5 – this represents a scenario where global warming reaches between 2 and 3°C by 2100;
- RCP 6.0 – acting as a stepping stone between RCP 4.5 and the highest carbon scenario (RCP 8.5), RCP 6.0 would result in higher global warming than RCP 4.5. This scenario is rarely referenced compared to the others; and,
- RCP 8.5 – the highest carbon scenario, RCP 8.5 would see global warming greatly surpass the 2°C limit imposed by the Paris Agreement. It would likely result in catastrophic and irreversible changes to the planet.
More details on the characteristics of each pathway can be found in the IPCC’s AR5 Synthesis Report.
These RCP scenarios are the building blocks for any other scenario modelling on physical risks to date. The outputs from the IPCC process may be difficult to use by companies directly as they are at global or large regional levels and so are often translated or interpreted by 3rd-party data service providers. With the AR6 report due for release in April 2021, updated climate scenarios can be expected in the near future.
IEA scenarios
The IEA’s scenarios are published in their annual flagship report, the World Energy Outlook (WEO). The IEA scenarios are focused on transitional climate risks. The IEA scenarios outlined in the WEO 2020 are unique because they reflect the current global pandemic situation. This makes them much more relevant to the near-future. The IEA’s WEO 2020 scenarios are:
- Stated Policies Scenario (STEPS) – this is based on the stated policies by governments around the world today, which track to below 3° of global warming, and the assumption that drops in global GDP due to COVID-19 are restored in 2021;
- Delayed Response Scenario (DRS) – based on the same policy context as the STEPS, the DRS differs in its delayed response to the pandemic, resulting in a return to pre-COVID global GDP by 2023;
- Sustainable Development Scenario (SDS) – the SDS sees a similar global response to COVID-19 as in the STEPS. But, it is characterized by a larger investment push for clean, renewable energy in the next ten years. This yields far fewer greenhouse gas emissions than the STEPS and DRS scenarios, and it caps global warming at 2 °C; and,
- Net Zero Emissions by 2050 (NZE2050) – Like the SDS and STEPS scenarios, the NZE2050 scenario features an immediate response and recovery from the pandemic. It is unique, however, in its approach to clean energy investment. It is the first scenario to explore what would be necessary over the next decade for the global economy to reach a net zero emissions profile by 2050. The NZE2050 features much more ambitious clean energy investments and behavioural changes than the SDS. The result is the first scenario to depict what is necessary to cap global warming at 1.5 °C.
The WEO 2020 also considers the future of all major energy technologies and fuels under each scenario. The IEA scenarios are focussed on and are helpful to companies in the energy industry as they explore the changes in structure and technology in this industry under the different global temperature rises. They are also used by other industries as a starting point for their own climate-related scenario analysis, especially if the industries are closely related to energy, e.g., mining and manufacturing. The IEA’s WEO 2020 overview provides further insights.
Other public scenarios
Figure 1 shows some of the most popularly used scenarios in 2020, but this is by no means an exhaustive list. Other notable scenarios include the SSPs (to be included in AR6), and those produced by the International Renewable Energy Agency (IRENA), Greenpeace, the Deep Decarbonization Pathways Project (DDPP), the Energy Watch Group, and the Network for Greening the Financial System (NGFS). These are not explored in this blog, but they may be worth investigating for your company’s specific climate scenario analysis needs.
For Canadian companies, the scenarios developed by the Canada Energy Regulator may be useful. Canada’s Energy Future 2020 report presents the Evolving Energy System Scenario and the Reference Energy System Scenario. These provide energy production/demand projections under different levels of greenhouse gas emissions reductions in Canada. The report also presents a “Towards Net-Zero” section. While not a full-fledged scenario, this section provides insights into what is required for Canada to reach net-zero emissions in its energy system.
Scenarios are continually being developed and updated. Tracking scenario developments can better equip you for improving your subsequent scenario analyses as these exercises will need to be refreshed periodically.
Scenario analysis is an iterative process
The work doesn’t stop once analysis under your chosen scenarios is complete. After completing your analysis, the insights will need to be applied to your company; and trends in the socio-economic systems towards the different plausible futures will need to be monitored. Tracking data can better prepare you to perform more rigorous scenario analyses down the line. For example, if you started out with a qualitative scenario narrative, you may have identified certain metrics that need to be tracked. Monitoring these to build a robust data pool puts you in better shape to conduct quantitative climate scenario analysis later on.
You should also monitor external scenario developments. A new scenario could be developed that better fits your company’s context than the one you used in your previous analysis. Or, your company’s needs may shift as the impacts of climate change become more apparent and new government policies get introduced.
As we’ve said before, climate scenario analysis is not a prediction tool. It helps you consider possible futures and develop response plans to them. However, the future is uncertain, and the need to prepare and strategize in anticipation of the uncertainties ahead will never cease.
Contact us to learn more
At Manifest Climate, we have experts in scenario analysis to guide your organization through considering and applying scenario analysis. If you’re interested in learning more, contact us now.
